Multi-Timeframe SFP + SMTImportant: Please Read First
This indicator is not a "one size fits all" solution. It is a professional and complex tool that requires you to learn how to use it, in addition to backtesting different settings to discover what works best for your specific trading style and the assets you trade. The default settings provided are my personal preferences for trading higher-timeframe setups, but you are encouraged to experiment and find your own optimal configuration.
Please note that while this initial version is solid, it may still contain small errors or bugs. I will be actively working on improving the indicator over time. Also, be aware that the script is not written for maximum efficiency and may be resource-intensive, but this should not pose a problem for most users.
The source code for this indicator is open. If you truly want to understand precisely how all the logic works, you can copy and paste the code into an AI assistant like Gemini or ChatGPT and ask it to explain any part of the script to you.
Author's Preferred Settings (Guideline)
As a starting point, here are the settings I personally use for my trading:
SFP Timeframe: 4-Hour (Strength: 5-5)
Max Lookback: 35 Bars
Raid Expiration: 1 Bar
SFP Lines Limit: 1
SMT Timeframe 1: 30-Minute (Strength: 2-2) with 3-Minute LTF Detection.
SMT Timeframe 2: 15-Minute (Strength: 3-3) with 3-Minute LTF Detection.
SMT Timeframe 3: 1-Hour (Strength: 1-1) with 3-Minute LTF Detection.
SMT Timeframe 4: 15-Minute (Strength: 1-1) with 3-Minute LTF Detection.
Multi-Timeframe SMT: An Overview
This indicator is a powerful tool designed to identify high-probability trading setups by combining two key institutional concepts: Swing Failure Patterns (SFP) on a higher timeframe and Smart Money Technique (SMT) divergences on a lower timeframe. A key feature is the ability to configure and run up to four independent SMT analyses simultaneously, allowing you to monitor for divergences across multiple timeframes (e.g., 15m, 1H, 4H) from a single indicator.
Its primary purpose is to generate automated signals through TradingView's alert system. By setting up alerts, the script runs server-side, monitoring the market for you. When a setup presents itself, it will send a push notification to your device, allowing you to personally evaluate the trade without being tied to your screen.
The Strategy: HTF Liquidity Sweeps into LTF SMT
The core strategy is built on a classic institutional trading model:
Wait for a liquidity sweep on a significant high timeframe (e.g., 4-hour, Daily).
Once liquidity is taken, look for a confirmation of a shift in market structure on a lower timeframe.
This indicator uses an SMT divergence as that confirmation signal, indicating that smart money may be stepping in to reverse the price.
How It Works: The Two-Step Process
The indicator's logic follows a precise two-step process to generate a signal:
Step 1: The Swing Failure Pattern (SFP)
First, the indicator identifies a high-timeframe liquidity sweep. This is configured in the "Swing Failure Pattern (SFP) Timeframe" settings.
It looks for a candle that wicks above a previous high (or below a previous low) but then closes back within the range of that pivot. This action is known as a "raid" or a "swing failure," suggesting the move failed to find genuine momentum.
Step 2: The SMT Divergence
The moment a valid SFP is confirmed, the indicator's multiple SMT engines activate.
Each engine begins monitoring the specific SMT timeframe you have configured (e.g., "SMT Timeframe 1," "SMT Timeframe 2," etc.) for a Smart Money Technique (SMT) divergence.
An SMT divergence occurs when two closely correlated assets fail to move in sync. For example, after a raid on a high, Asset A makes a new high, but Asset B fails to do so. This disagreement suggests weakness and a potential reversal.
When the script finds this divergence, it plots the SMT line and triggers an alert.
The Power of Alerts
The true strength of this indicator lies in its alert capabilities. You can create alerts for both unconfirmed and confirmed SMTs.
Enable Alerts LTF Detection: These alerts trigger when an unconfirmed, potential SMT is spotted on the lower "LTF Detection" timeframe. While not yet confirmed, these early alerts can notify you of a potential move before it fully happens, allowing you to be ahead of the curve and find the best possible trade entries.
Enable Alerts Confirmed SMT: These alerts trigger only when a permanent, confirmed SMT line is plotted on your chosen SMT timeframe. These signals are more reliable but occur later than the early detection alerts.
Key Concepts Explained
What is Pivot Strength?
Pivot Strength determines how significant a high or low needs to be to qualify as a valid structural point. A setting of 5-5, for example, means that for a candle's high to be considered a valid pivot high, its high must be higher than the highs of the 5 candles to its left and the 5 candles to its right.
Higher Strength (e.g., 5-5, 8-8): Creates fewer, but more significant, pivots. This is ideal for identifying major structural highs and lows on higher timeframes.
Lower Strength (e.g., 2-2, 3-3): Creates more pivots, making it suitable for identifying the smaller shifts in momentum on lower timeframes.
Raid Expiration & Validity
An SFP signal is not valid forever. The "Raid Expiration" setting determines how many SFP timeframe bars can pass after a raid before that signal is considered "stale" and can no longer be used to validate an SMT. This ensures your SMT divergences are always in response to recent liquidity sweeps.
Why You Must Be on the Right Chart Timeframe to See SMT Lines
Pine Script™ has a fundamental rule: an indicator running on a chart can only "see" the bars of that chart's timeframe or higher.
When the SMT logic is set to the 15-minute timeframe, it calculates its pivots based on 15-minute data. To accurately plot lines connecting these pivots, you must be on a 15-minute chart or lower (e.g., 5-minute, 1-minute).
If you are on a higher timeframe chart, like the 1-hour, the 15-minute bars do not exist on that chart, so the indicator has no bars to draw the lines on.
This is precisely why the alert system is so powerful. You can set your alert to run on the 15-minute timeframe, and TradingView's servers will monitor that timeframe for you, sending a notification regardless of what chart you are currently viewing.
在脚本中搜索"market structure"

Volatility Wick Trap — Smart Reversal EngineThe Volatility Wick Trap — Smart Reversal Engine is a precision reversal detection tool designed for traders who rely on smart money footprints, volatility compression, and liquidity wick exhaustion to time entries near market turns.
💡 Core Components:
Volatility Squeeze Detection: Identifies candles where range compresses significantly compared to the 14-period average true range, highlighting potential breakout zones.
Liquidity Wick Exhaustion: Detects candles with dominant upper or lower wicks, signaling failed liquidity grabs or stop hunts.
Contextual EMA Filter: Uses a 21-period EMA to filter signals, improving accuracy by aligning with market structure bias.
🔍 How It Works:
Green diamond lines mark bullish hidden reversal zones.
Red diamond lines mark bearish hidden reversal traps.
These lines only appear when volatility compresses and wick traps are confirmed within the trend context.
✅ Clean. Minimal. Tactical.
Ideal for scalpers, swing traders, and smart money enthusiasts looking to fade emotional price spikes.

Zig Zag with HHLLThis powerful tool calculates and displays two Zig Zag patterns simultaneously while dynamically identifying key market structure points—Higher Highs (HH), Lower Lows (LL), Higher Lows (HL), and Lower Highs (LH).
Because the script is dynamic, the most recent HH, HL, LL, or LH can update in real-time as price action evolves. For example, if the price continues to rise, a previously marked HL may be reclassified as an LL. Likewise, a falling LH may later turn into a HH if the market reverses.
This script is versatile and can be applied to various trading strategies, including trend analysis, support and resistance identification, breakout setups, and more.
Added a new input parameter decimals that allows you to control the decimal precision:
Set to -1 (default) for automatic detection based on the symbol's minimum tick size
Set to 0-8 for a specific number of decimal places.
How it works:
Auto mode (decimals = -1): The script automatically determines how many decimal places to show based on the instrument's minimum tick size. For example:
Forex pairs (0.00001) → 5 decimals
Stocks ($0.01) → 2 decimals
Crypto (0.00000001) → 8 decimals
Manual mode (decimals = 0-8): You can force a specific number of decimal places if needed

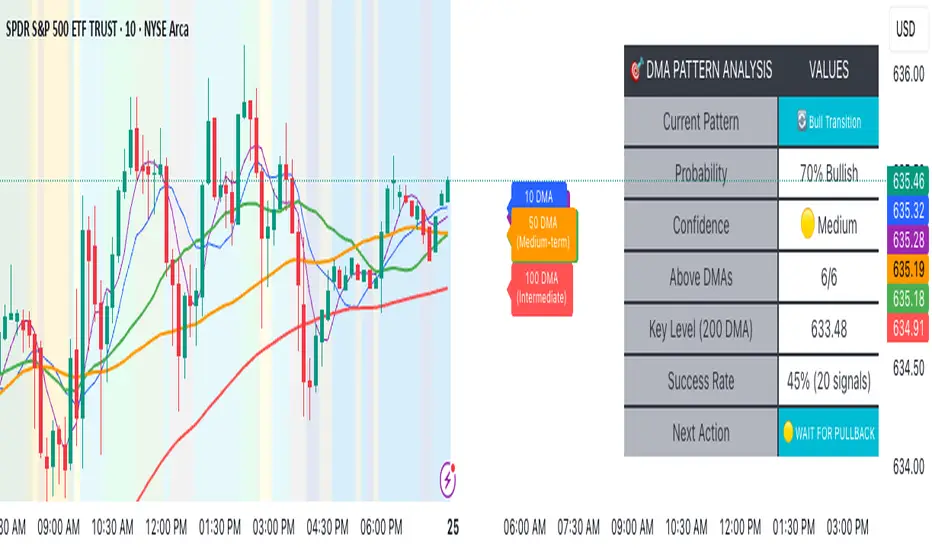
Advanced DMA Pattern Detection SystemAdvanced DMA Pattern Detection System with Smart Intelligence
Professional-grade moving average indicator that combines traditional DMA analysis with advanced pattern recognition and probabilistic forecasting.
Core Features:
6 Key DMAs (5, 10, 20, 50, 100, 200) with descriptive labels showing trading purpose
Advanced Pattern Recognition - Detects Institutional Accumulation, Distribution Phases, Bull/Bear Transitions, and Choppy Markets
Probability Engine - Assigns confidence scores (0-100%) with Low/Medium/High classifications
Historical Validation - Tracks success rate of last 20 pattern signals for real performance data
Smart Alert System - Only triggers on significant pattern changes (20%+ probability shifts)
Dual Display System:
Movable Information Table - Shows current pattern, probability, confidence level, success rate, and recommended action
Chart Alerts & Background Colors - Visual confirmation of high-confidence setups (80%+ patterns)
Traditional DMA Labels - Clear identification of each average's trading significance
Complete Customization:
Master on/off controls for entire system
Individual toggles for all components (DMAs, table, alerts, colors)
Adjustable alert sensitivity (Conservative/Medium/Aggressive)
6 table positions to fit any chart layout
Perfect For: Swing traders, position traders, and anyone wanting systematic trend analysis with quantified probability scores rather than subjective interpretation.
Bottom Line: Transforms basic moving averages into an intelligent trading system that tells you exactly what the market structure means and what to do about it.
🇰🇷 Kim'in Kim'out — Korean Premium TrackerKim’in Kim’out is a premium-tracking TradingView indicator that reveals Korean market sentiment by comparing real-time asset prices on Upbit (KRW) and Binance (USDT).
It detects when Korean traders are spot accumulating (Kim’in) or spot distributing (Kim’out) — enhanced by volume confirmation and trend context.
Perfect for crypto scalpers, swing traders, and arbitrage hunters.
⚙️ How It Works
Kimchi Premium: Measures how much more (or less) Koreans are paying on Upbit compared to Binance.
Volume Confirmation: Filters signals by comparing Upbit volume vs its moving average.
Signal Logic:
🔼 Kim’in: Premium exceeds the buy threshold + high volume
🔽 Kim’out: Premium drops below the sell threshold + high volume
Trend Context: Premium trend line gives insight into sustained interest/disinterest.
🎛️ Settings Overview
Input Description
Select Cryptocurrency Choose from supported coins (BTC, ETH, SOL, etc.)
Buy Threshold (%) How high the premium must be to trigger a Kim’in signal
Sell Threshold (%) How low the premium must be to trigger a Kim’out signal
Volume MA Period The number of candles for volume average
Volume Multiplier Volume spike ratio needed to confirm a signal
Show Info Table Toggle detailed premium stats in a side panel
Show Premium Zones Visual background zones (green/red/yellow)
Debug Mode Shows extra signals that trigger without volume confirmation
✅ How to Use It
Add the indicator to any chart (e.g. BTC/USDT)
Choose a coin from the dropdown (BTC, ETH, etc.)
Watch for:
Green Triangle Up (Kim’in) = Korean spot buy pressure confirmed
Red Triangle Down (Kim’out) = Korean selloff or disinterest
Use the Info Table (top-right) to see:
Premium %
Volume confirmation
Real-time KRW-USD exchange rate
Upbit vs Binance price comparison
Set Alerts:
Right-click on a signal → Add Alert on "Kim’in" or "Kim’out"
Or use the prebuilt alertconditions
🔔 Alert Messages
🇰🇷 Korean Premium BUY signal detected → Kim’in
🇰🇷 Korean Premium SELL signal detected → Kim’out
🧪 Best Practices
Use on 1H or 4H timeframe for best results
Confirm with broader market structure or confluence tools
Spot divergences between Binance and Upbit to predict regional flow shifts
🚫 Limitations
Works only with coins that have both Binance USDT & Upbit KRW pairs
Premium may be delayed by low liquidity or FX rate fluctuations (USDKRW)
Not suitable for lowcaps not listed on Upbit
Created by UKMC Crypto

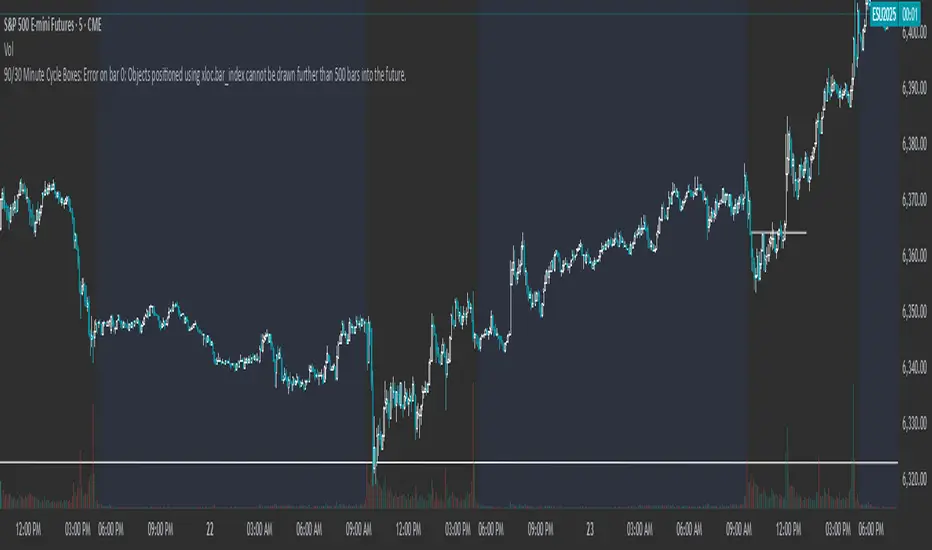
90/30 Minute Cycle BoxesThis indicator automatically draws time-based cycle boxes to help visualize market structure and cyclical behavior.
Features:
90-Minute Primary Cycles: Highlights each 90-minute interval with a colored box, showing the high and low of that period.
30-Minute Sub-Cycles: Each 90-minute box is divided into 3 sub-boxes representing 30-minute phases.
Multi-Timeframe Compatible: Works on all timeframes, adapting dynamically to your chart.
Visual Clarity: Alternating box colors make it easy to track price action within and across cycles.
This tool is ideal for traders who use time cycles in their analysis, especially those applying ICT, Smart Money Concepts, or time-based market theories.
Multi-Timeframe SMTSummery
The Multi-Timeframe SMT indicator is designed to identify and visualize Higher Timeframe (HTF) data on a Lower Timeframe (LTF) chart, allowing traders to see the broader market context without changing their current chart's resolution. It accurately draws pivots and SMT divergences from higher timeframes on the corresponding candles of your current lower timeframe chart.
Its core features include:
Multi-Timeframe Analysis: Configure and monitor pivots on up to four independent timeframes, from intraday to monthly.
Customizable Pivot Detection: Define the strength of pivots by adjusting the number of bars to the left and right.
SMT Divergence: Automatically identifies bullish and bearish SMT divergences by comparing the price action of the main chart symbol with a chosen correlated asset.
Early SMT Detection: A unique feature that monitors a lower "detection timeframe" to provide early warnings of potential SMT setups before they're confirmed on the main timeframe. Note that this early detection is only shown on timeframes equal to or lower than the "Detection timeframe" you have set.
Visual Cues & Alerts: Clear on-chart labels, lines, and fully customizable alerts notify you of confirmed pivots and SMT divergences, ensuring you don't miss key opportunities.
Important Nuance Regarding Pivot Label Display
Due to a self-imposed limit within this script's drawing management logic, the indicator might quickly reach its drawing capacity if you enable pivot crosses for multiple timeframes simultaneously. When this internal drawing limit is exceeded, the script is designed to automatically remove the oldest drawings to make space for new ones.
Therefore, to ensure optimal performance and visibility of the most recent and relevant pivots, it's highly recommended to only enable the "Show Pivot Crosses" option for one timeframe at a time. If you wish to view pivots for a different timeframe, simply disable the pivot crosses for the currently active timeframe and then enable them for your desired one. This approach prevents the rapid cycling and disappearance of pivot labels, providing a clearer and more stable visual experience.
In-Depth Explanation of the Logic
This script is built on two primary concepts: pivot points and Smart Money Technique (SMT) divergence. It systematically collects historical data on multiple timeframes, identifies pivots, and then compares them between two assets to find divergences.
Pivot Point Identification
A pivot is a turning point in the market. A pivot high is a candle that has a higher high than the candles to its immediate left and right. Conversely, a pivot low is a candle with a lower low than its neighbors.
How it Works in the Script:
The script tracks the highest high and lowest low for each period of the selected timeframe (e.g., for each 4-hour candle). When a new high-timeframe candle closes, it stores that high/low value and its bar index in an array. The checkForPivot() function then checks if a recently stored high or low qualifies as a pivot.
Key Inputs:
Left Strength (leftBars1): The number of candles to the left that must have a lower high (for a pivot high) or higher low (for a pivot low).
Right Strength (rightBars1): The number of candles to the right that must meet the same criteria.
For example, with Left Strength and Right Strength both set to 3, a pivot high is only confirmed when its high is greater than the highs of the 3 previous high-timeframe candles and the 3 subsequent high-timeframe candles. Increasing these values will identify more significant, longer-term pivots.
Smart Money Technique (SMT) Divergence
SMT Divergence is a concept popularized by The Inner Circle Trader (ICT). It occurs when two closely correlated assets fail to move in sync. For instance, if Asset A makes a higher high but Asset B fails to do so and instead makes a lower high, this creates a bearish SMT divergence. It suggests that the "smart money" may not be supporting the move in Asset A, signaling a potential reversal.
Bearish SMT: Main asset makes a higher high, while the correlated asset makes a lower high. This is a potential sell signal.
Bullish SMT: Main asset makes a lower low, while the correlated asset makes a higher low. This is a potential buy signal.
How it Works in the Script:
Data Request: For each timeframe, the script uses the request.security() function to fetch the high and low data for both the main chart symbol (syminfo.tickerid) and the chosen Comparison Asset.
Pivot Comparison: When a new pivot is confirmed on the main asset, the script checks if a corresponding pivot also formed on the comparison asset at the same time.
Divergence Check: It then compares the direction of the pivots. For a bearish SMT, it checks if the main asset's new pivot high is higher than its previous pivot high, while the comparison asset's new pivot high is lower than its previous one. The logic is reversed for bullish SMT.
Visualization: If a divergence is found, the script draws a red (bearish) or green (bullish) line connecting the two pivots on your chart and places an "SMT" label.
Early SMT Detection
This is a proactive feature designed to give you a heads-up. Waiting for a 4-hour or daily pivot to form can take a long time. The early detection system looks for SMT divergences on a much smaller, user-defined Detection timeframe (e.g., 15-minute).
How it Works in the Script:
Awaiting Setup: After a primary pivot (Pivot A) is formed on the main timeframe (e.g., a Daily pivot high), the script begins monitoring.
Intraday Monitoring: It then watches the Detection timeframe (e.g., 15-minute) for smaller intraday pivots.
Potential Divergence: It looks for an intraday pivot that forms a divergence against the primary Pivot A.
Watchline & Alert: When this "potential" divergence occurs, the script draws a dashed white line and triggers a "Potential SMT" alert. This isn't a confirmed SMT on the main timeframe yet, but it's a powerful early warning that one may be forming.
Drawing & Object Management
To keep the chart clean and prevent performance issues, the script manages its drawings (lines and labels) efficiently. It stores them in arrays and uses a drawing limit to automatically delete the oldest drawings as new ones are created, ensuring your TradingView remains responsive.
How to Use the Indicator
Configuration
Enable Timeframes: Use the checkboxes (Enable Timeframe 1, Enable Timeframe 2, etc.) to activate the timeframes you want to monitor. It's often best to start with one or two to keep the chart clean.
Select Timeframes: Choose the higher timeframes you want to analyze (e.g., 240 for 4-hour, D for Daily, W for Weekly).
Set Pivot Strength: The default of 3 for Left/Right strength is a good starting point. Increase it to find more significant market structure points or decrease it for more frequent, shorter-term pivots.
Configure SMT:
Check Enable SMT for the timeframes where you want to detect divergence.
Enter a Comparison Asset . This is crucial. Ensure the assets are correlated.
To use the early warning system, check Enable early SMT detection and select an appropriate Detection timeframe (e.g., 15 or 60 minutes for a Daily analysis).

Institutional Sessions Overlay (Asia/London/NY)Institutional Sessions Overlay is a professional TradingView indicator that visually highlights the main trading sessions (Asia, London, and New York) directly on your chart.
Customizable: Easily adjust session start and end times (including minutes) for each market.
Timezone Alignment: Shift session boxes using the timezone offset parameter so sessions match your chart’s timezone exactly.
Clear Visuals: Colored boxes and optional labels display session opens and closes for fast institutional market structure reference.
Toggle Labels: Show or hide session open/close labels with a single click for a clean or detailed look.
Intuitive UI: User-friendly grouped settings for efficient configuration.
This tool is designed for day traders, institutional traders, and anyone who wants to instantly recognize global session timing and ranges for SMC, ICT, and other session-based strategies.
How to use:
Set your chart to your local timezone.
Use the "Session timezone offset" setting if session boxes do not match actual session opens on your chart.
Adjust the hours and minutes for each session as needed.
Enable or disable labels in the “Display” settings group.
Tip: Use the overlay to spot session highs and lows, volatility windows, and institutional liquidity sweeps.

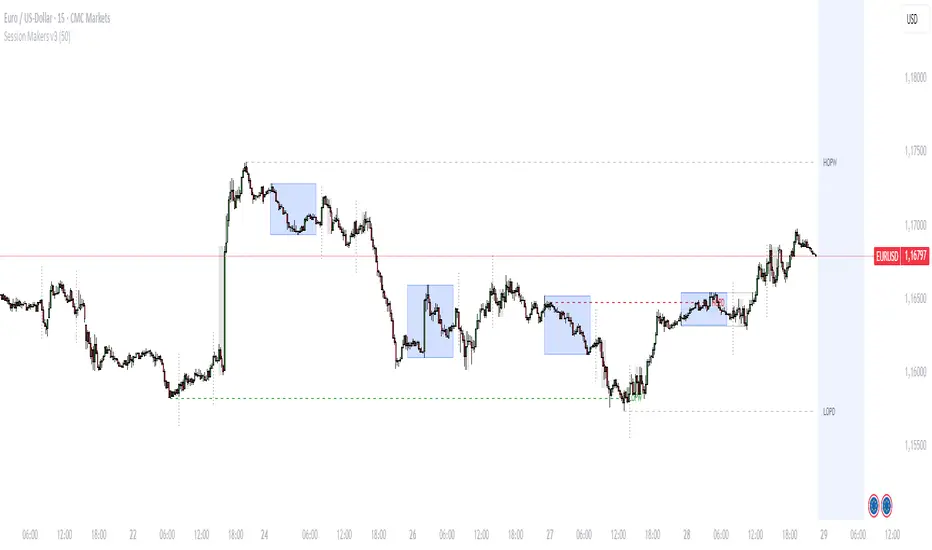
Session Makers v1
Session Makers v1 - Professional Trading Session Visualizer
This advanced indicator highlights key trading sessions and market structure levels, helping traders identify optimal trading times and important price levels.
Key Features:
Session Time Markers
- Vertical dotted lines at major market opens (London/New York)
- Appears 30 minutes before each session for early preparation
Interactive Session Boxes
- Asia Session (22:00-06:00 GMT) - Blue shaded area
- London AM (08:00-09:00 GMT) - Gray shaded area
- London/New York Overlap (14:00-15:00 GMT) - Gray shaded area
Key Reference Levels
- Yesterday's high/low (with touch alerts)
- Previous week's high/low (with touch alerts)
- Asia session high/low/mid lines
Smart Visual Design
- Clean, non-cluttered visuals that adapt to your chart
- Customizable colors and transparency for all elements
- Optimized for all timeframes (M1-H4)
only use in timeframes <= 15 min
Weekly Range PlotterThe Weekly Range Plotter is a dynamic market structure tool designed to help traders visualize critical high and low levels from specific days of the week and the previous week's range. It provides key visual anchors to support analysis of market behavior, including range compression/expansion and directional bias.

BSL & SSL - Liquidity Zones
BSL & SSL - Liquidity Zones
Indicator Description (for TradingView)
Concept
The BSL & SSL - Liquidity Zones indicator is a simple yet powerful visual tool that helps traders identify key liquidity zones in the market by tracking prominent highs and lows on the chart.
It is based on the concept that the Highest High (Buy Side Liquidity - BSL) and Lowest Low (Sell Side Liquidity - SSL) represent zones where stop-loss orders and pending orders accumulate — often attracting future price movements.
Purpose
This indicator helps traders spot hidden liquidity levels which may act as targets or potential reversal points. It is especially useful for traders who apply Smart Money Concepts (SMC) or institutional trading models.
Great for detecting potential stop hunts and understanding market structure shifts.
How It Works
The indicator calculates the Highest High and Lowest Low over a user-defined period (default: 20 candles).
When a new Higher High forms, it marks a new BSL.
When a new Lower Low forms, it marks a new SSL.
These zones are likely to attract price in the future — either as targets or traps.
Visualization
The indicator draws static horizontal lines (Stepline style) at BSL and SSL levels.
These lines remain in place until broken or a new level is formed.
Visual Labels enhance clarity:
🟢 Green Label → BSL
🔴 Red Label → SSL
Trading Insights / Practical Use
When price approaches a BSL or SSL zone, ask yourself:
✅ Will price break the level to grab liquidity?
✅ Will there be a reversal after liquidity is taken?
The indicator does not provide signals by itself — it serves as a valuable confirmation tool when combined with:
Price Action
Support & Resistance
Momentum Indicators
SMC Tools
Key Benefits
✅ Easy to use
✅ Enhances liquidity analysis
✅ Highlights zones targeted by institutional players
✅ Simple calculation — no complex formulas
Limitations
🚫 Does NOT generate buy/sell signals
🚫 Should be used as part of a complete trading framework
Conclusion
BSL & SSL - Liquidity Zones is a versatile and intuitive tool for any trader looking to better understand where liquidity is positioned on the chart.
It works across all timeframes and complements any trading strategy, especially Smart Money-based approaches.

AP Session Liquidity with EQH/EQL and Previous DayThis indicator plots key intraday session highs and lows, along with essential market structure levels, to help traders identify areas of interest, potential liquidity zones, and high-probability trade setups. It includes the Asia Session High and Low (typically 00:00–08:00 UTC), London Session High and Low (08:00–12:00 UTC), New York AM Session High and Low (12:00–15:00 UTC), and New York Lunch High and Low (15:00–17:00 UTC). Additionally, it displays the Previous Day’s High and Low for context on recent price action, as well as automatically detected Equal Highs and Lows based on configurable proximity settings to highlight potential liquidity pools or engineered price levels. These session levels are widely used by institutional traders and are critical for analyzing market behavior during time-based volatility windows. Traders can use this indicator to anticipate breakouts, fakeouts, and reversals around session boundaries—such as liquidity grabs at Asia highs/lows before the London or New York sessions—or to identify key consolidation and expansion zones. Equal Highs and Lows serve as magnets for price, offering insight into potential stop hunts or inducement zones. This tool is ideal for day traders, scalpers, and smart money concept practitioners, and includes full customization for session timings, color schemes, line styles, and alert conditions. Whether you're trading price action, ICT concepts, or supply and demand, this indicator provides a powerful framework for intraday analysis.

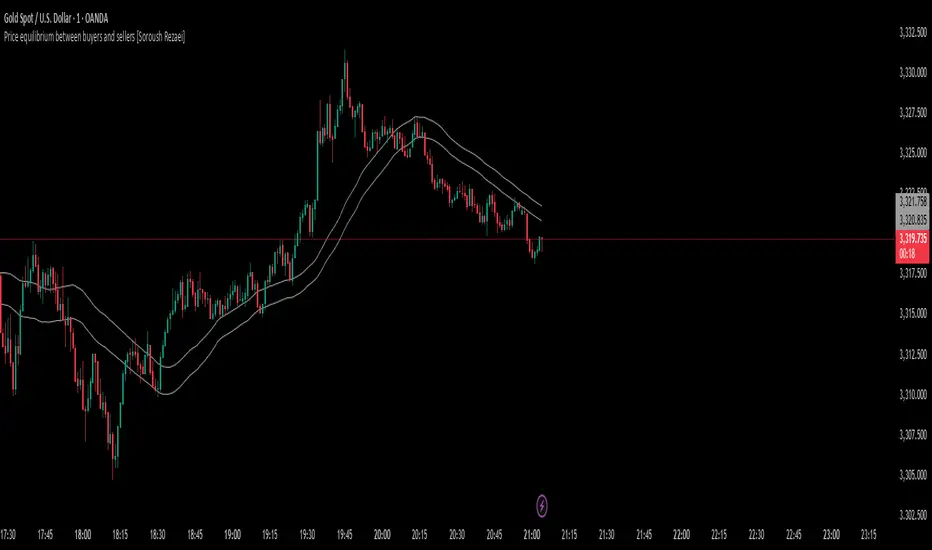
Price equilibrium between buyers and sellers [Soroush Rezaei]This indicator visualizes the dynamic balance between buyers and sellers using two simple moving averages (SMAs) based on the high and low prices.
The green line (SMA of highs) reflects the upper pressure zone, while the red line (SMA of lows) represents the lower support zone.
When price hovers between these two levels, it often signals a state of temporary equilibrium — a consolidation zone where buyers and sellers are relatively balanced.
Use this tool to:
Identify ranging or balanced market phases
Spot potential breakout or reversal zones
Enhance your multi-timeframe or price action strategy
Recommended for intraday and swing traders seeking visual clarity on market structure and momentum zones.
Multi-Timeframe S&R Zones (Shaded)This indicator automatically plots support and resistance zones based on recent price action across multiple timeframes:
🟥 Daily
🟧 4-Hour
🟨 1-Hour
🟩 30-Minute
🟦 5-Minute
Each zone is color-coded by timeframe and represented as a shaded region instead of a hard line, giving you a clearer and more dynamic view of key market levels. The zones are calculated from recent swing highs (resistance) and swing lows (support), and each zone spans ±5 pips for precision.
Only the most recent levels are displayed—up to 3 per timeframe—and are limited to the last 48 hours to avoid chart clutter and keep your workspace clean.
✅ Key Benefits:
Price Action Based: Zones are drawn from actual market structure (swings), not arbitrary levels.
Multi-Timeframe Clarity: View confluence across major intraday and higher timeframes at a glance.
Color-Coded Zones: Instantly distinguish between timeframes using intuitive colour coordination.
Clean Charts: Only shows the latest relevant levels, automatically expires old zones beyond 48 hours.
Flexible & Lightweight: Built for Tradingview Essential; optimized for performance.

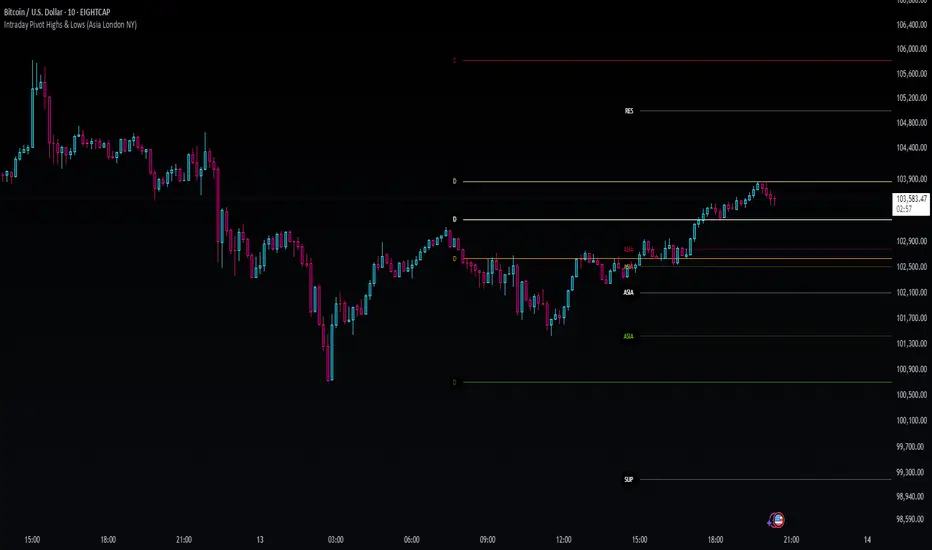
Intraday Pivot Highs & Lows (Asia London NY)Intraday Pivot Highs & Lows (Asia London NY)
Script Description
This TradingView indicator is optimized for Forex, scalping, intraday, and day trading strategies. It accurately plots Pivot Points and levels, high/low, support and resistance levels. These are clearly identified to aid the trader during killzone sessions and session opens. Ideal for scalp trading, intraday sessions, and leveraging SMT (Smart Money Techniques). Utilize these Price Levels effectively during London Open, NY Open, and the Asia Session, utilizing Market Structure to pinpoint key levels and reversal zones for successful trading. Improve your Trade Setups, recognize reliable Chart Patterns, identify critical Price Pivots, and trade confidently off Institutional Levels.
This script marks the intraday pivot highs, lows and midpoints retracement levels for
Asia
London
New York
It also plots the previous day's high, low, midpoint, and 0.618 Fibonacci retracement levels, providing traders with critical price reference points for making intraday trading decisions.
Originality & Usefulness
This indicator uniquely integrates pivot calculations across three major Forex sessions (Asia, London, NY), clearly delineating session boundaries.
It enhances visibility by using distinct styling
solid for New York
dashed for London
dotted lines for Asia
And colour co-ordinated labeling, improving traders' ability to identify important intraday price action zones efficiently. Unlike standard pivot indicators, this script emphasizes session-specific trading dynamics.
### Key Features ###
Session-Based Levels: Automatically plots high, low, midpoint, and Fibonacci (.618) levels for each major session (Asia, London, NY).
Distinct Visual Cues: Lines and labels use session-specific styles and colors to easily differentiate between sessions.
Previous Day Reference: Clearly plots and labels yesterday's high, low, midpoint, and Fibonacci levels.
Flexible Visibility: Traders can set timeframe visibility to maintain clean charts on higher timeframes.
### How It Works
At the start of next day's session, previous session lines are cleared, ensuring the chart remains uncluttered.
High, low, midpoint, and Fibonacci retracement levels (.618) are dynamically calculated and displayed at the close of each session.
All session levels remain visible until the start of the next respective session, providing continuous actionable insights.
Trading Application:
Session highs and lows act as strong intraday support and resistance zones.
Midpoints and Fibonacci levels are effective for identifying potential reversal zones and retracements.
Daily levels provide a broader context, useful for gauging intraday volatility and range.
### Limitations and Considerations ##
Best used on liquid assets with clear session-based price action, such as Forex major pairs, if used on indexes make sure they contain 24 hour price action not just New York session.
This indicator is designed to streamline intraday trading by clearly marking essential pivot points and session-based levels, significantly improving traders' market context and decision-making accuracy. Can be used to enhance SMT decision making when scalping killzones.
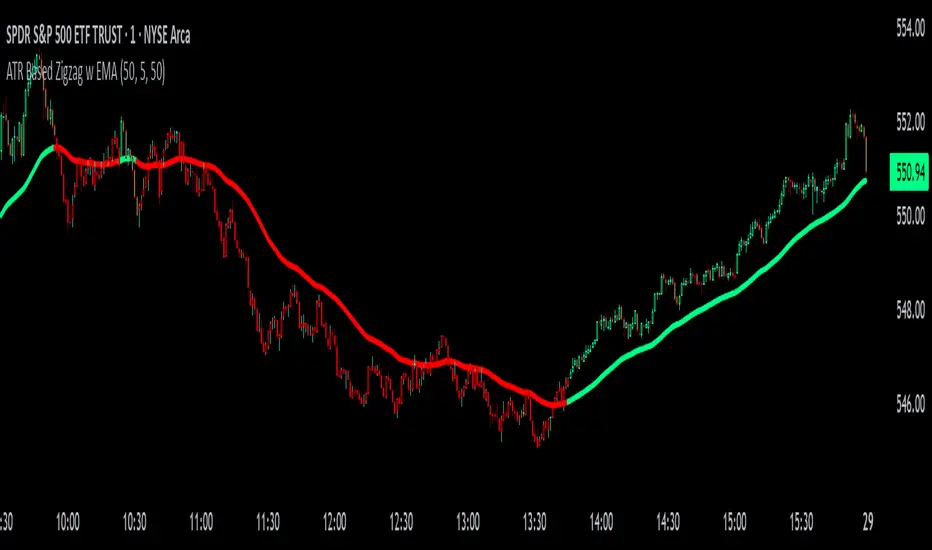
ATR Based Zigzag w EMAThe "ATR Based Zigzag with EMA" indicator is a refined trend-following tool designed for traders who demand clarity, precision, and robust trend detection. This script uses an ATR (Average True Range)-based breakout mechanism to dynamically determine the current market trend, while overlaying a clean, smoothed EMA (Exponential Moving Average) line to visually represent the active directional bias.
The indicator continuously tracks new swing highs and lows based on ATR volatility thresholds. When price moves sufficiently against the current trend — exceeding an ATR-multiplied distance — the trend is considered reversed. This adaptive method ensures that trend flips are based not on arbitrary price action, but on meaningful, volatility-adjusted movements.
Instead of plotting zigzag-style pivots which can create visual noise, the indicator draws a single, smooth EMA line calculated from the median price ((high + low) / 2). The color of the line shifts instantly based on the active trend: green (or your customized color) for uptrends, and red for downtrends. In addition, individual price bars are optionally colored to match the trend, further enhancing at-a-glance clarity without cluttering the chart.
Key user-defined inputs include the ATR length, ATR multiplier (sensitivity for trend flips), EMA smoothing length (responsiveness of the trend line), and full color customization for uptrend and downtrend states.
This indicator excels at providing a clear and immediate understanding of trend conditions, making it highly effective for:
Trend-following strategies
Reversal spotting based on volatility breaks
Entry/exit confirmation
Visual chart cleanliness and minimalism
Whether used standalone or alongside other tools, the "ATR Based Zigzag with EMA" offers a disciplined, volatility-sensitive view of market structure — engineered for traders who refuse to tolerate noise, hesitation, or ambiguity in their decision-making.
Apex Edge SMC Tactical Suite
🛰 Apex Edge SMC Tactical Suite
Apex Edge SMC Tactical Suite is a precision-engineered multi-signal tool designed for advanced traders who demand real-time edge detection, breakout identification, and smart volatility-based risk placement. Built to blend seamlessly into any price action, SMC, or momentum-based strategy.
🔧 Core Features:
📍 Entry Signals
Green & red arrows appear only when a candle meets strict "Power Candle" criteria:
High momentum breakout
Volume spike confirmation
OBV spike divergence
Trend & HTF filter optional
Volatility-adjusted stop placement
💥 Power Candles
Smart detection of explosive volume+range candles
Custom "fuel score" system ranks their momentum potential
Displays as either candle highlights or subtle labels
📊 Fuel Meter
RSI-based energy tracker with customizable threshold
Plots real-time bar strength on a mini histogram
🧠 Trap Detection + Reversals
Detects stop hunt wicks or "liquidity traps"
Shows reversal diamonds on potential reclaim setups
Built-in swing logic confirms trap reversals
🧮 HTF Filtering
Optional higher-timeframe trend filter via Hull MA
Keeps signals aligned with broader market direction
📦 TP/SL Zones
Risk is calculated using volatility clustering (recent swing zones)
TP auto-calculated using ATR-based expansion
🔔 Alerts Included:
✅ Power Candle Detection
✅ Long/Short Entry Alerts
✅ Exit Signal Alerts
✅ Trap Defense Alerts
✅ Trap Reversal Confirmations
🎯 Ideal For:
SMC / ICT traders
Breakout traders
Trend followers
Scalpers / intraday setups
Momentum + volume combo traders
⚠️ Tip: Best paired with clean chart layouts, market structure, or order block frameworks. Can be combined with internal/external liquidity sweep logic for extra confluence.
Feel free to play around with the code and if you're a professional coder (unlike me) then please tag me into any versions that you can make better. Enjoy!
Disclaimer - This script was created entirely with many hours using the assistance of ChatGPT

Multi Timeframe Altered Money Flow Index by CoffeeShopCryptoMoney Flow Index is a long used tool in trading markets, understanding to where money is moving and most importantly when its going there.
One of the biggest challenges was the when part. Because seeing it on your current trading chart timeframe is easy but it gets difficult if youre attempting a top-down-analysis of market structure vs price performance.
The new formula presented by @CoffeeshopCrypto is a key solution to this timeframe analysis issue. Seems like I may have solved the "glitch-In-The-Matrix".
The issue was always setting a secondary MFI on your chart and telling the system you wanted to watch the 1 hour MFI from a 5 minute chart.
To do this you need to wait for 12 candles to close on your 5 minute chart before you can get a 1hour MFI value. The move may have already happend and you may be too late. If there was only a better faster way to see the changing values of the High Timeframe Money Flow Index in real time without changing chart times and losing place......oh wait.....there is one now!
This tool allows you to tell it what timeframe you are looking at,
and what you want to compare it to.
It runs the calculation in the background automatically to give you the real time values of your High Timeframe chart setting on the chart you are looking at.
How to trade Long
When both the LFT and HTF Money flow cross above ZERO, they are both in uptrend
How to trade Short
When both the LFT and HTF Money flow cross below ZERO, they are both in downtrend
What happens when Low timeframe is inside the high timeframe:
If High timeframe MFI is below zero but the LFT MFI is above it and still below zero, you have lost your short term downtrend. The opposite is true when the high timeframe MFI is above zero.
A strong constant comparative trend is when your low timeframe MFI is leading your High timeframe MFI.
Personal Settings:
In my usage, i find it best to multiply my trading chart timeframe by 3 and use that number as my high timeframe MFI setting
This works on ANY chart time you want. For example you are not locked to the standard built TradingView chart times.
If you trade on a 7 minute timeframe, you can set your HTF to 21.
7 * 3 = 21

StonkGame Major Market Open/ClosePlots vertical lines for Tokyo, London, and New York session opens and closes — auto-adjusted to your chart's timezone.
Open lines = lighter, dashed style.
Close lines = solid, full-color style.
Helps identify key liquidity windows, session-driven volatility, and clean market structure — without chart clutter.
Fully customizable colors and line styles for a professional, minimal look.

Liquidity Zones Alerts"Liquidity Zones Alerts" is a powerful smart-money-based indicator designed to detect key liquidity grabs and provide high-probability reversal signals using a combination of market structure, volume, volatility, and candlestick confirmation.
🧠 How It Works
The core logic of this indicator is built around the Smart Money Concepts:
🔺 Liquidity Sweeps: Detects when price takes out previous daily or weekly highs/lows, suggesting stop hunts or engineered liquidity moves by institutional players.
📈 Volume Filter: Ensures signals only appear during above-average volume, filtering out noise and low-interest moves.
⚡ Volatility Filter: Flags high-range candles relative to the average, catching flash crashes/spikes that often precede strong reversals.
🔄 Engulfing Candle Confirmation: Confirms entry with a bullish or bearish engulfing pattern after liquidity is taken — increasing signal reliability.
🧭 Premium/Discount Zone Logic: Trades are filtered to ensure longs are only taken in discount zones, and shorts in premium zones, using a 20-period market range for context.
📌 Features
✅ Daily & Weekly liquidity zones toggle
✅ Visual signals with clean 🔻(short) & 🔺(long) arrows
✅ Auto-detection of flash crashes
✅ Alerts on both long and short setups
✅ Optional previous high/low level plotting for context
✅ Background highlighting of valid signal candles
✅ Multi-timeframe friendly and compatible with any asset
🛠️ Use Case
Whether you're a scalper or a swing trader, this tool helps you spot institutional entry zones before the move happens. It works especially well when combined with your existing bias or supply/demand zones.
💬 “Price doesn't move randomly — it hunts liquidity. This indicator shows you where and when it happens.”

CandelaCharts - Premium & Discount 📝 Overview
Premium and Discount are key concepts in ICT (Inner Circle Trader) trading strategies, used to pinpoint ideal entry and exit points in the market. These concepts are based on an understanding of market structure and the behavior of institutional traders, commonly referred to as Smart Money.
To understand the Premium and Discount zones, it's crucial to first grasp the concept of the equilibrium level, also known as the basic or fair value. The equilibrium represents the midpoint of a given price range and acts as a reference point, dividing the range into Premium and Discount zones.
The equilibrium reflects the "fair value" of the price within the considered range. Traders use this as a benchmark to assess whether the current price is in the Premium or Discount zone.
The Premium zone lies above the equilibrium level, while the Discount zone is located below it within the price range.
📦 Features
Swing-based detection
Custom detection
Modes
Styling
⚙️ Settings
Range: Determines how you will identify Premium and Discount, either by swing points or by custom date.
Mode: Controls what UI will be displayed
Premium: Sets the Premium color
Discount: Sets the Discount color
Equilibrium: Sets the Equilibrium color
Labels: Controls the labels visibility
⚡️ Showcase
Pro Mode
Solid Mode
Outlined Mode
Flat Mode
The Indicator can be effortlessly applied in replay mode to highlight premium and discount zones based on the most prominent market swings.
🚨 Alerts
The indicator does not provide any alerts!
⚠️ Disclaimer
Trading involves significant risk, and many participants may incur losses. The content on this site is not intended as financial advice and should not be interpreted as such. Decisions to buy, sell, hold, or trade securities, commodities, or other financial instruments carry inherent risks and are best made with guidance from qualified financial professionals. Past performance is not indicative of future results.

JPMorgan Collar LevelsThis indicator visualizes the current JPMorgan Hedging Collar strategy commonly used by institutional funds like JHEQX. It plots three key levels:
– Short Call strike (upper bound)
– Long Put strike (protection level)
– Short Put strike (cost reduction)
The area between the long put and short call is shaded to represent the active hedging zone. This setup is updated quarterly and can influence SPX market behavior near expiration dates.
Inputs are customizable to reflect the latest collar configuration. Useful for traders tracking institutional hedging flows or analyzing market structure near key option expirations.

Williams Fractals Ultimate (Donchian Adjusted)Williams Fractals Ultimate (Donchian Adjusted)
Understanding Williams Fractals
Williams Fractals are a simple yet powerful tool used to identify potential turning points in the market. They highlight local highs (up fractals) and local lows (down fractals) based on a set period.
An up fractal appears when a price peak is higher than the surrounding prices.
A down fractal appears when a price low is lower than the surrounding prices.
Fractals help traders spot support and resistance levels, potential trend reversals, and price breakout zones.
Why Adjust Fractals with the Donchian Channel?
The standard Williams Fractals method identifies local highs and lows without considering broader market context. This script enhances fractal accuracy by integrating the Donchian Channel, which tracks the highest highs and lowest lows over a set period.
- The Donchian Baseline is calculated as the average of the highest high and lowest low over a selected period.
- Fractals are filtered based on this baseline:
Up Fractals are only shown if they are above the Donchian baseline.
Down Fractals are only shown if they are below the Donchian baseline.
This filtering method removes weak signals and ensures that only relevant fractals aligned with market structure are displayed.
Key Features of the Script
Customizable Fractal & Donchian Periods – Allows traders to fine-tune fractal sensitivity.
Donchian-Based Filtering – Reduces noise and highlights meaningful fractals.
Fractal ZigZag Line (Optional) – Helps visualize price swings more clearly.
Why Is This So Effective?
Stronger trend signals – Filtering with the Donchian baseline eliminates unreliable fractals.
Clearer price action – The optional ZigZag line visually connects significant highs and lows.
Easy trend identification – Helps traders confirm breakout zones and key price levels.
This script is a technical analysis tool and does not guarantee profitable trades. Always combine it with other indicators and risk management strategies before making trading decisions.
